Create scatter plots of factors or loadings for a flash fit
Source:R/flash_plots.R
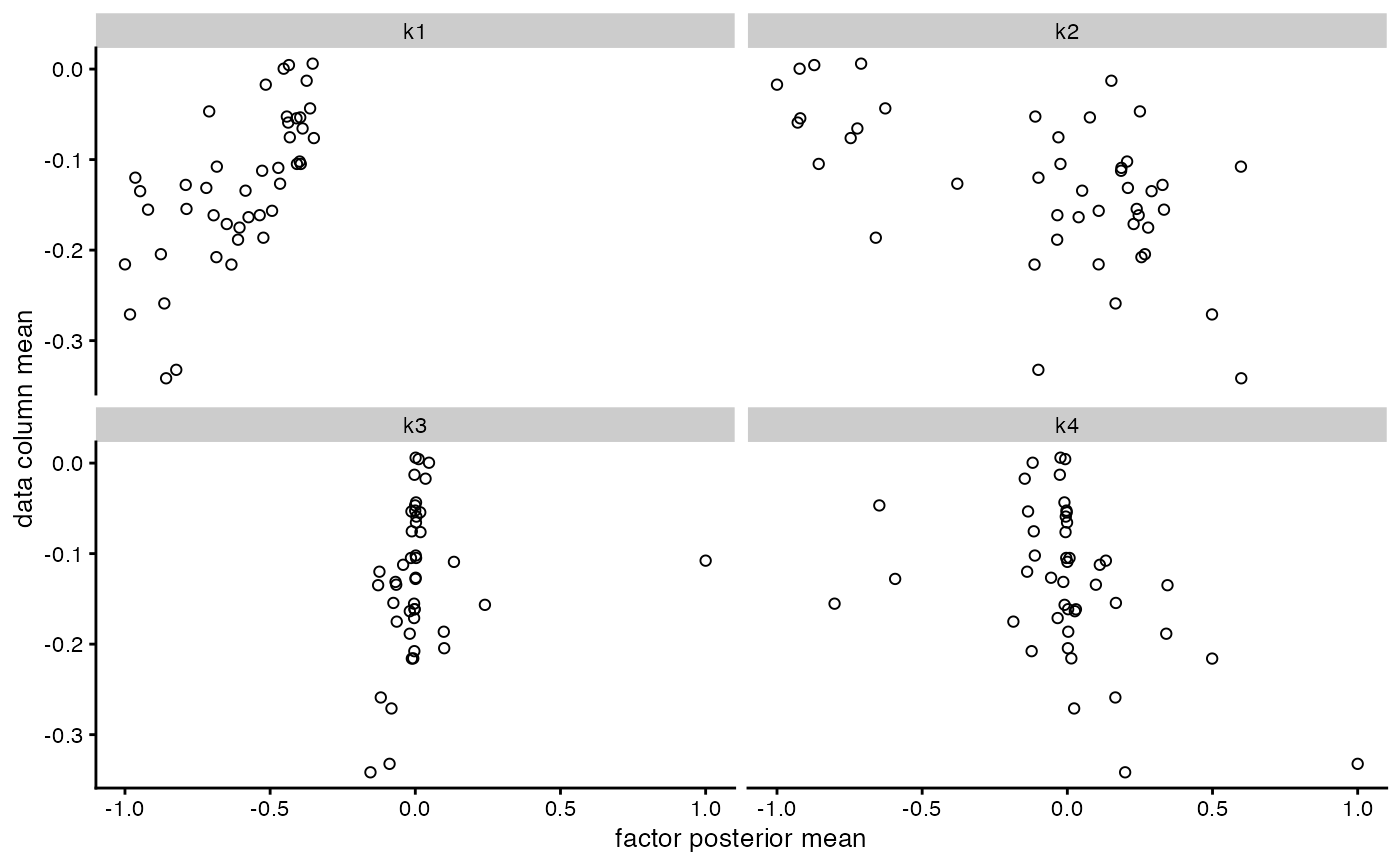
flash_plot_scatter.RdCreates a scatter plot or sequence of scatter plots, with position along the
\(x\)-axis defined by posterior means for factors \(f_{jk}\) or loadings
\(\ell_{ik}\) and position along the \(y\)-axis defined by a
user-supplied covariate. If a covariate is not supplied, then plots will
use data column or row means, \(\frac{1}{n} \sum_{i = 1}^n y_{ij}\) or
\(\frac{1}{p} \sum_{j = 1}^p y_{ij}\). One plot is created for
each value of \(k\) in kset. Values are normalized so that the
maximum absolute value for each factor \(f_{\cdot k}\) or set of
loadings \(\ell_{\cdot k}\) is equal to 1 (see ldf.flash).
flash_plot_scatter(
  fl,
  order_by_pve = FALSE,
  kset = NULL,
  pm_which = c("factors", "loadings"),
  pm_subset = NULL,
  pm_groups = NULL,
  pm_colors = NULL,
  covariate = NULL,
  shape = 1,
  labels = FALSE,
  n_labels = 0,
  label_size = 3,
  max_overlaps = Inf,
  ...
)
Arguments
- fl
An object inheriting from class
flash.- order_by_pve
If
order_by_pve = TRUE, then factor/loadings pairs will be ordered according to proportion of variance explained, from highest to lowest. (By default, they are plotted in the same order askset; or, ifksetisNULL, then they are plotted in the same order as they are found infl.)- kset
A vector of integers specifying the factor/loadings pairs to be plotted. If
order_by_pve = FALSE, thenksetalso specifies the order in which they are to be plotted.- pm_which
Whether to plot loadings \(L\) or factors \(F\).
- pm_subset
A vector of row indices \(i\) or column indices \(j\) (depending on the argument to
pm_which) specifying which values \(\ell_{i \cdot}\) or \(f_{j \cdot}\) are to be shown. If the dataset has row or column names, then names rather than indices may be specified. Ifpm_subset = NULL, then all values will be plotted.- pm_groups
A vector specifying the group to which each row of the data \(y_{i \cdot}\) or column \(y_{\cdot j}\) belongs (groups may be numeric indices or strings). A group must be provided for each plotted row \(i\) or column \(j\), so that the length of
pm_groupsis exactly equal to the number of rows or columns in the full dataset or, ifpm_subsetis specified, in the subsetted dataset.- pm_colors
A character vector specifying a color for each unique group specified by
pm_groups, or, ifpm_groups = NULL, a vector specifying a color for each plotted row \(i\) or column \(j\). Defines the colors of the points.- covariate
A numeric vector with one value for each plotted row \(i\) or column \(j\). These values are mapped onto the plots' \(y\)-axis.
- shape
The symbol used for the plots' points. See
aes_linetype_size_shape.- labels
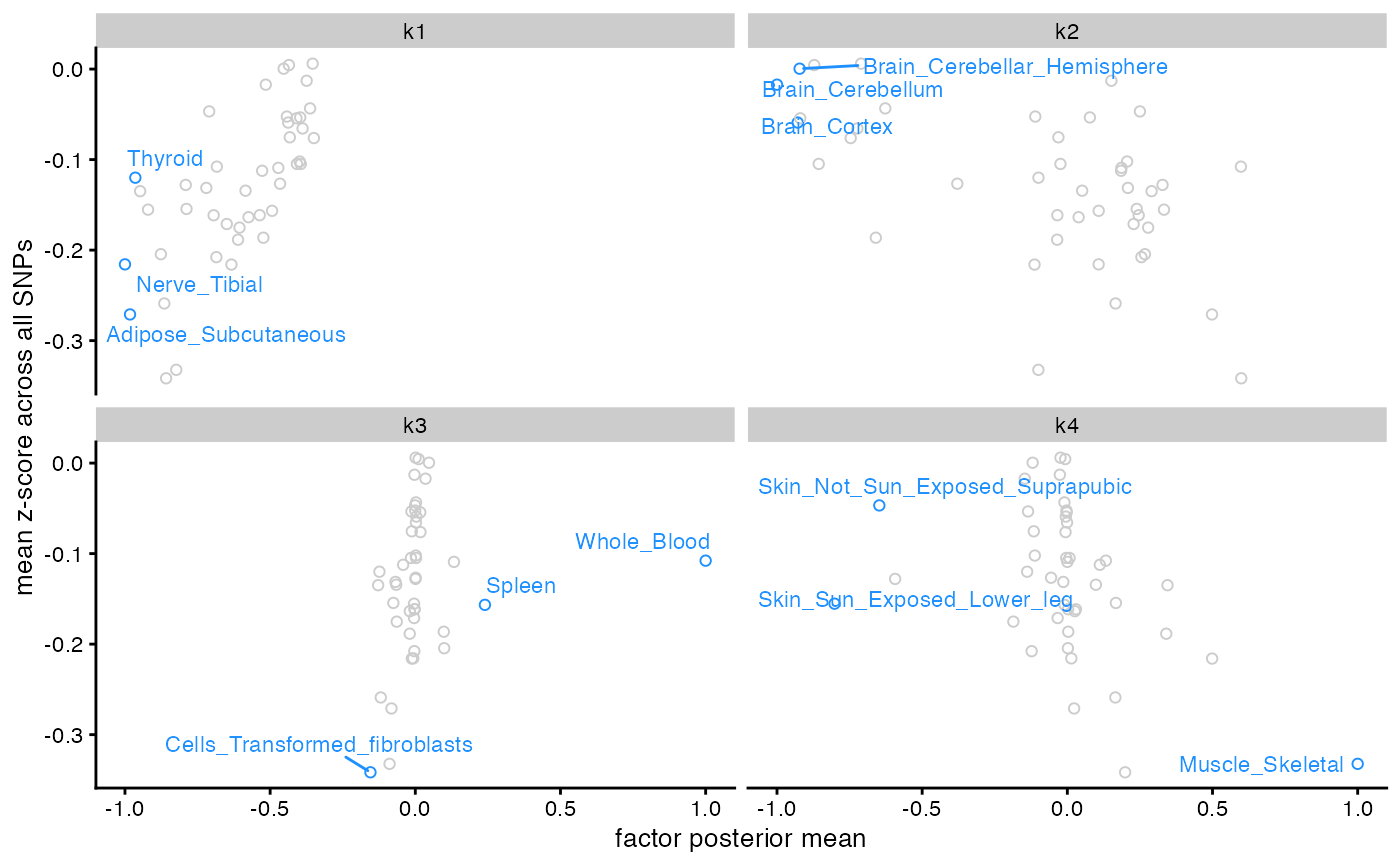
Whether to label the points with the largest (absolute) posterior means. If
labels = TRUE, thenn_labelspoints will be labelled usinggeom_text_repel.- n_labels
A (nonnegative) integer. The number of points to label. If
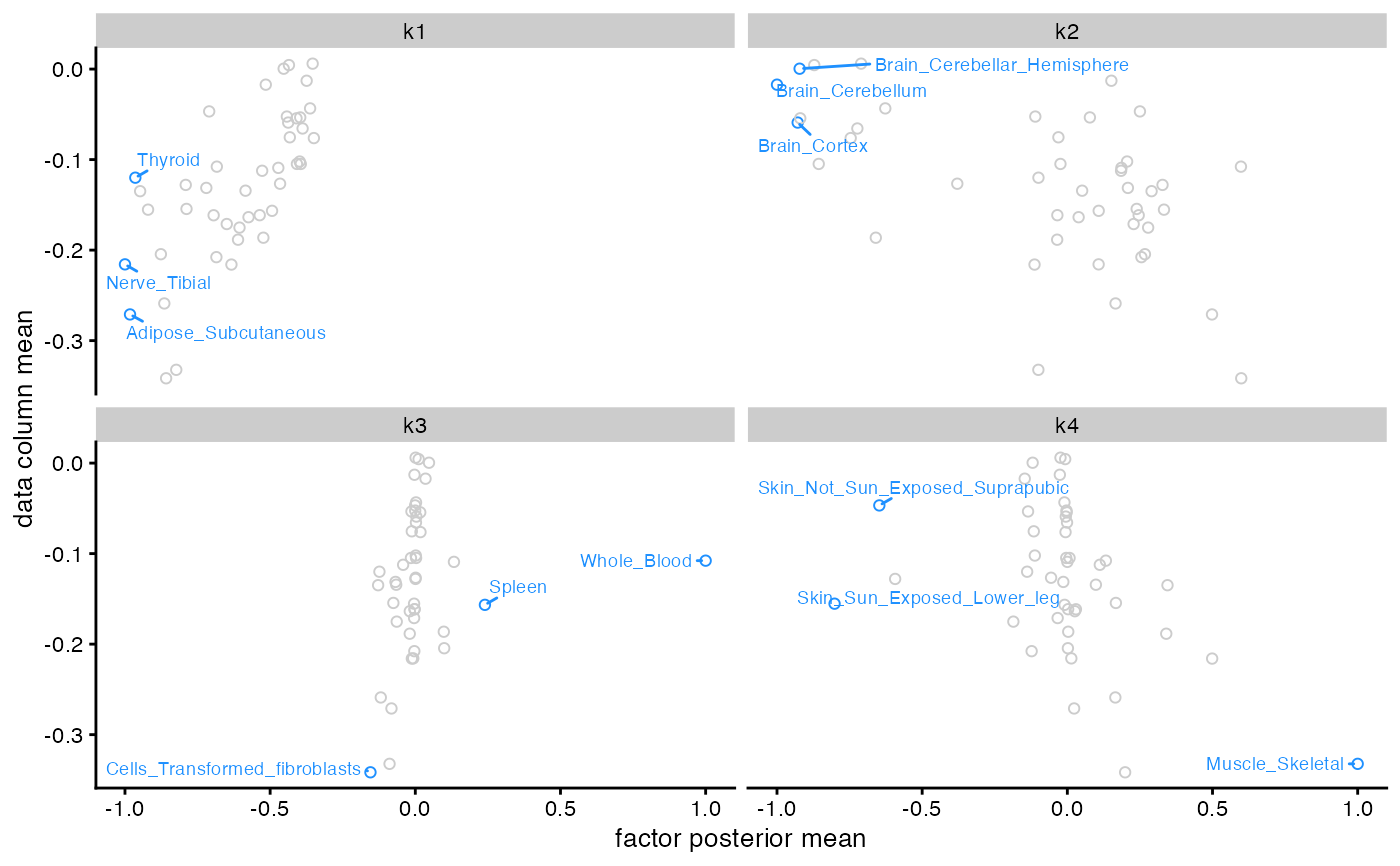
n_labelsis set to a positive integer butlabels = FALSE, then then_labelspoints with the largest (absolute) posterior means will be highlighted in blue but not labelled. This can be useful for tweaking labels using the full range of options provided bygeom_text_repel. For an example, see below.- label_size
The size of the label text (in millimeters).
- max_overlaps
A (nonnegative) integer. For each text label, the number of overlaps with other text labels or other data points are counted, and the text label is excluded if it has too many overlaps.
- ...
Additional arguments to be passed to
facet_wrap(e.g.,nroworncol).
Value
A ggplot object.
Examples
data(gtex)
fl <- flash(gtex, greedy_Kmax = 4L, backfit = FALSE)
#> Adding factor 1 to flash object...
#> Adding factor 2 to flash object...
#> Adding factor 3 to flash object...
#> Adding factor 4 to flash object...
#> Wrapping up...
#> Done.
#> Nullchecking 4 factors...
#> Done.
flash_plot_scatter(fl)


# Label axes and points:
library(ggplot2)
flash_plot_scatter(fl, labels = TRUE, n_labels = 3) +
  labs(y = "mean z-score across all SNPs")


# For the full range of labelling options provided by the ggrepel package, set
#   labels = FALSE (the default setting) and add geom_text_repel() manually:
library(ggrepel)
flash_plot_scatter(fl, labels = FALSE, n_labels = 3) +
  geom_text_repel(size = 2.5, min.segment.length = 0)
