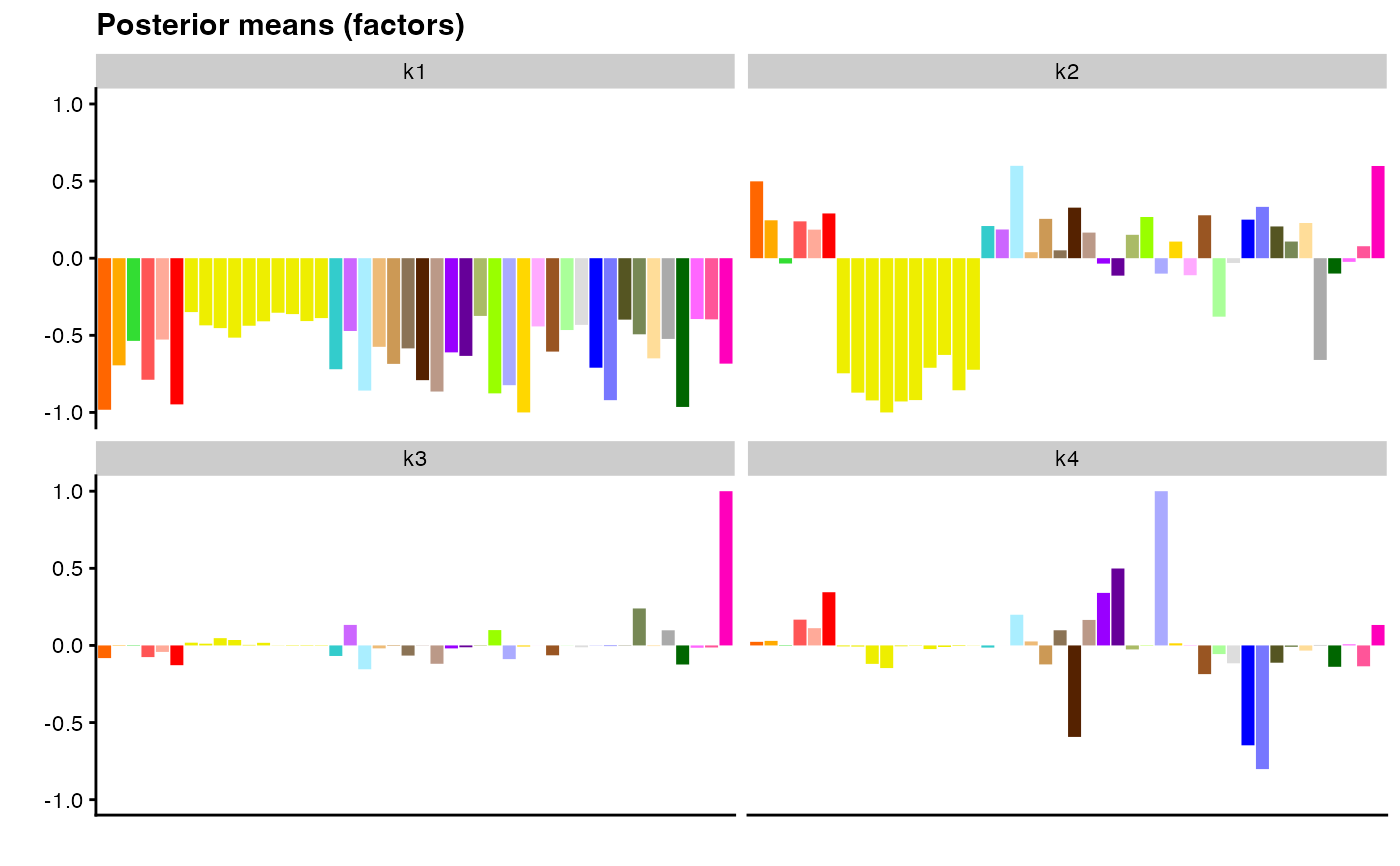
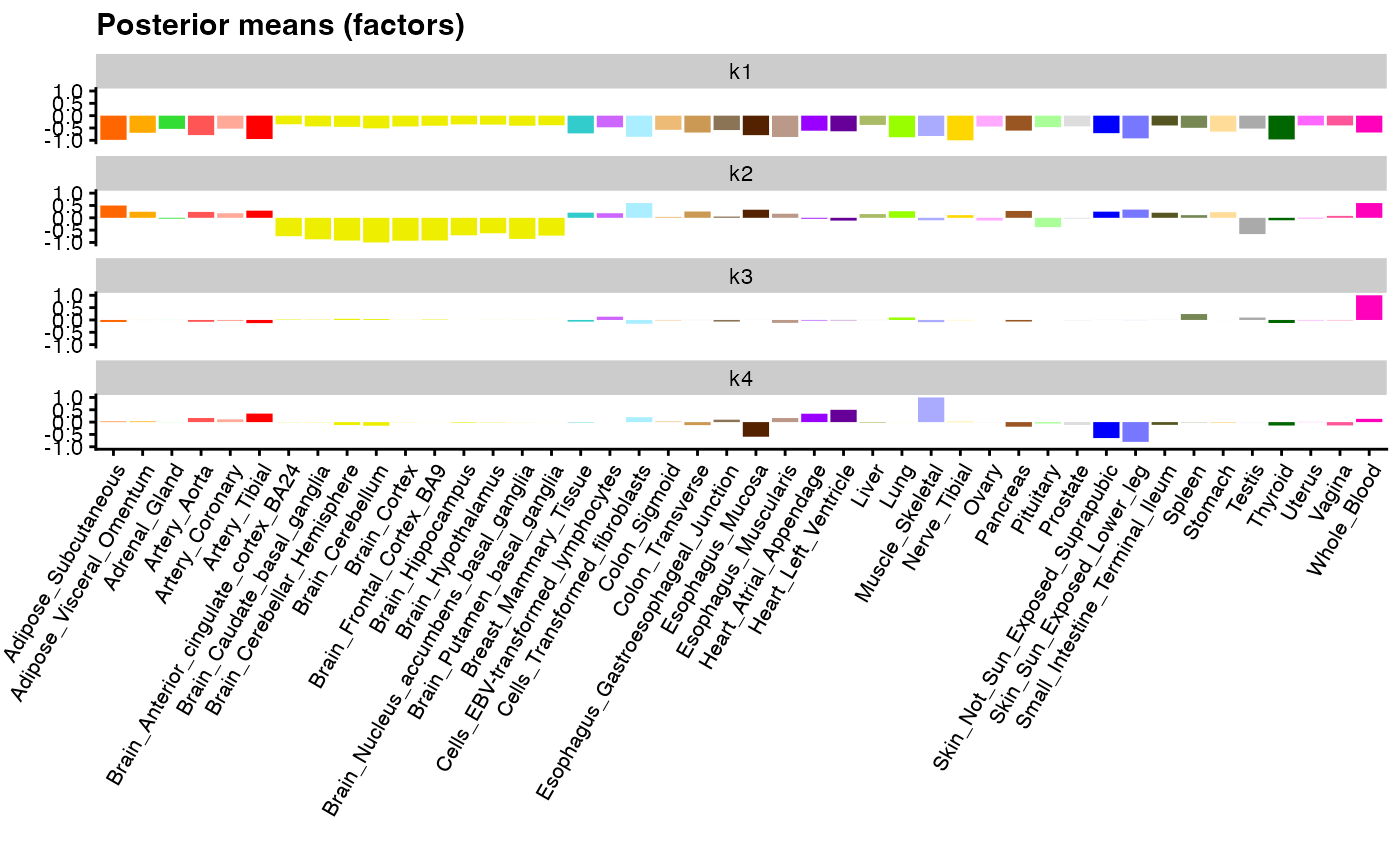
Creates a bar plot or sequence of bar plots, one for each value of \(k\) in
kset, with bars corresponding to individual posterior means for factors
\(f_{jk}\) or loadings \(\ell_{ik}\). Values are normalized so that the
maximum absolute value for each factor \(f_{\cdot k}\) or set of
loadings \(\ell_{\cdot k}\) is equal to 1 (see ldf.flash).
This type of plot is most useful when rows \(i = 1, \ldots, n\) or columns
\(j = 1, \ldots, p\) are small in number or ordered in a logical fashion
(e.g., spatially).
flash_plot_bar(
  fl,
  order_by_pve = FALSE,
  kset = NULL,
  pm_which = c("factors", "loadings"),
  pm_subset = NULL,
  pm_groups = NULL,
  pm_colors = NULL,
  labels = FALSE,
  ...
)
Arguments
- fl
An object inheriting from class
flash.- order_by_pve
If
order_by_pve = TRUE, then factor/loadings pairs will be ordered according to proportion of variance explained, from highest to lowest. (By default, they are plotted in the same order askset; or, ifksetisNULL, then they are plotted in the same order as they are found infl.)- kset
A vector of integers specifying the factor/loadings pairs to be plotted. If
order_by_pve = FALSE, thenksetalso specifies the order in which they are to be plotted.- pm_which
Whether to plot loadings \(L\) or factors \(F\).
- pm_subset
A vector of row indices \(i\) or column indices \(j\) (depending on the argument to
pm_which) specifying which values \(\ell_{i \cdot}\) or \(f_{j \cdot}\) are to be shown. If the dataset has row or column names, then names rather than indices may be specified. Ifpm_subset = NULL, then all values will be plotted.- pm_groups
A vector specifying the group to which each row of the data \(y_{i \cdot}\) or column \(y_{\cdot j}\) belongs (groups may be numeric indices or strings). A group must be provided for each plotted row \(i\) or column \(j\), so that the length of
pm_groupsis exactly equal to the number of rows or columns in the full dataset or, ifpm_subsetis specified, in the subsetted dataset.- pm_colors
A character vector specifying a color for each unique group specified by
pm_groups, or, ifpm_groups = NULL, a vector specifying a color for each plotted row \(i\) or column \(j\). Defines the color (fill) of the bars.- labels
Whether to label the bars along the \(x\)-axis. The appearance of the labels (size, angle, etc.) can be adjusted using
ggplot2's theme system; see below for an example.- ...
Additional arguments to be passed to
facet_wrap(e.g.,nroworncol).
Value
A ggplot object.
Details
When there is more than one value of \(k\) in kset, a sequence of
panels is created using the facet_wrap function from
the ggplot2 package. In each panel, the order of bars is determined
by the order of the corresponding rows or columns in the data matrix;
they can be re-arranged using the pm_subset argument.
Examples
data(gtex)
fl <- flash(gtex, greedy_Kmax = 4L, backfit = FALSE)
#> Adding factor 1 to flash object...
#> Adding factor 2 to flash object...
#> Adding factor 3 to flash object...
#> Adding factor 4 to flash object...
#> Wrapping up...
#> Done.
#> Nullchecking 4 factors...
#> Done.
flash_plot_bar(fl, pm_colors = gtex_colors)


# Tweaks are often required to get x-axis labels to look good:
library(ggplot2)
flash_plot_bar(fl, pm_colors = gtex_colors, labels = TRUE, ncol = 1) +
  theme(axis.text.x = element_text(size = 8, angle = 60))
