Thoughts on CorShrink
Last updated: 2018-09-15
workflowr checks: (Click a bullet for more information)-
✔ R Markdown file: up-to-date
Great! Since the R Markdown file has been committed to the Git repository, you know the exact version of the code that produced these results.
-
✔ Environment: empty
Great job! The global environment was empty. Objects defined in the global environment can affect the analysis in your R Markdown file in unknown ways. For reproduciblity it’s best to always run the code in an empty environment.
-
✔ Seed:
set.seed(20180609)The command
set.seed(20180609)was run prior to running the code in the R Markdown file. Setting a seed ensures that any results that rely on randomness, e.g. subsampling or permutations, are reproducible. -
✔ Session information: recorded
Great job! Recording the operating system, R version, and package versions is critical for reproducibility.
-
Great! You are using Git for version control. Tracking code development and connecting the code version to the results is critical for reproducibility. The version displayed above was the version of the Git repository at the time these results were generated.✔ Repository version: 54b746b
Note that you need to be careful to ensure that all relevant files for the analysis have been committed to Git prior to generating the results (you can usewflow_publishorwflow_git_commit). workflowr only checks the R Markdown file, but you know if there are other scripts or data files that it depends on. Below is the status of the Git repository when the results were generated:
Note that any generated files, e.g. HTML, png, CSS, etc., are not included in this status report because it is ok for generated content to have uncommitted changes.Ignored files: Ignored: .DS_Store Ignored: .Rhistory Ignored: .Rproj.user/ Ignored: data/ Ignored: docs/.DS_Store Ignored: docs/images/.DS_Store Ignored: docs/images/.Rapp.history Ignored: output/.DS_Store Ignored: output/.Rapp.history Ignored: output/MASHvFLASHgtex/.DS_Store Ignored: output/MASHvFLASHsims/.DS_Store Ignored: output/MASHvFLASHsims/backfit/.DS_Store Ignored: output/MASHvFLASHsims/backfit/.Rapp.history Untracked files: Untracked: code/MASHvFLASHcorshrink.R Untracked: code/MASHvFLASHnn2.R Untracked: code/MASHvFLASHnnrefine.R Untracked: code/MASHvFLASHortho.R Untracked: output/MASHvFLASHnn2/
Expand here to see past versions:
Introduction
This analysis was prompted by Dey and Stephen’s claim that data imputation (as performed by, for example, FLASH) “grossly distorts” correlation estimates.
My main thought is that data imputation produces de-noised estimates. With the GTEx data, FLASH tends to estimate missing data near the mean of the available data (or some multiple thereof). So of course the imputed data will show strong correlations.
This observation leads me to wonder whether CorShrink does not proceed from somewhat flawed principles. CorShrink operates on the noisy data itself, which is necessarily less correlated than the corresponding “true” effects (unless errors are strongly correlated, but this does not seem to be the case for the GTEx data). So in fact, it seems desirable to take an approach that increases the empirical correlations rather than shrinking them towards zero (or towards some other mean).
Example
Take the case where effects are strongly correlated across all conditions, but effect sizes are small. (This is, of course, a quite realistic scenario.)
n <- 100
p <- 25

# mean of effects is 0.5, sd is 0.2; correlation is 0.8
Sigma <- matrix(0.04 * 0.8, nrow=p, ncol=p)
diag(Sigma) <- 0.04
true_effects <- MASS::mvrnorm(n = n, mu = rep(0.5, p), Sigma = Sigma)

data <- true_effects + matrix(rnorm(n*p), nrow=n, ncol=p)
CorShrink
CorShrink finds no correlations in such data.
out <- CorShrink::CorShrinkData(data, image="both")
Expand here to see past versions of corshrink-1.png:
| Version | Author | Date |
|---|---|---|
| 5dac94e | Jason Willwerscheid | 2018-09-15 |
Allowing the mode to be non-zero does not greatly improve matters.
out <- CorShrink::CorShrinkData(data, image="both",
                                ash.control = list(mode = "estimate"))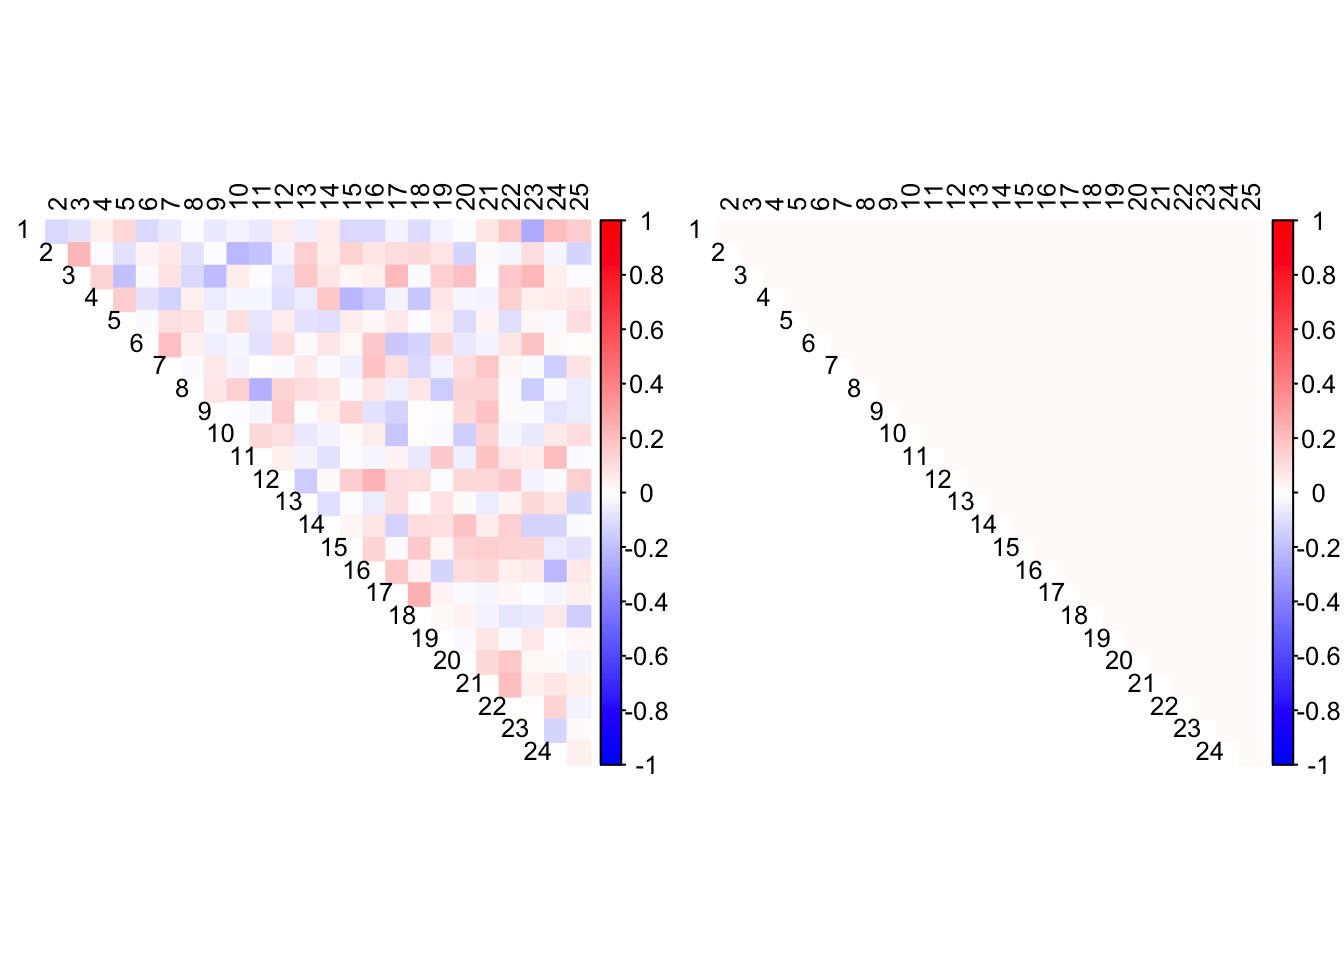
Expand here to see past versions of corshrink2-1.png:
| Version | Author | Date |
|---|---|---|
| 5dac94e | Jason Willwerscheid | 2018-09-15 |
FLASH
FLASH, however, finds a rank-one structure. A truly rank-one structure would of course mean that the data was perfectly correlated, but I think that in this case FLASH comes much closer to the truth than CorShrink.
devtools::load_all("~/GitHub/flashr/")Loading flashrdevtools::load_all("~/GitHub/ebnm/")Loading ebnmfl <- flash(data, verbose=FALSE)
flSummary of flash object:
Number of factor/loading pairs: 1
Proportion of variance explained:
Factor/loading 1: 0.162
Value of objective function: -3688.319barplot(fl$ldf$f[, 1], main="Factor values for factor/loading 1")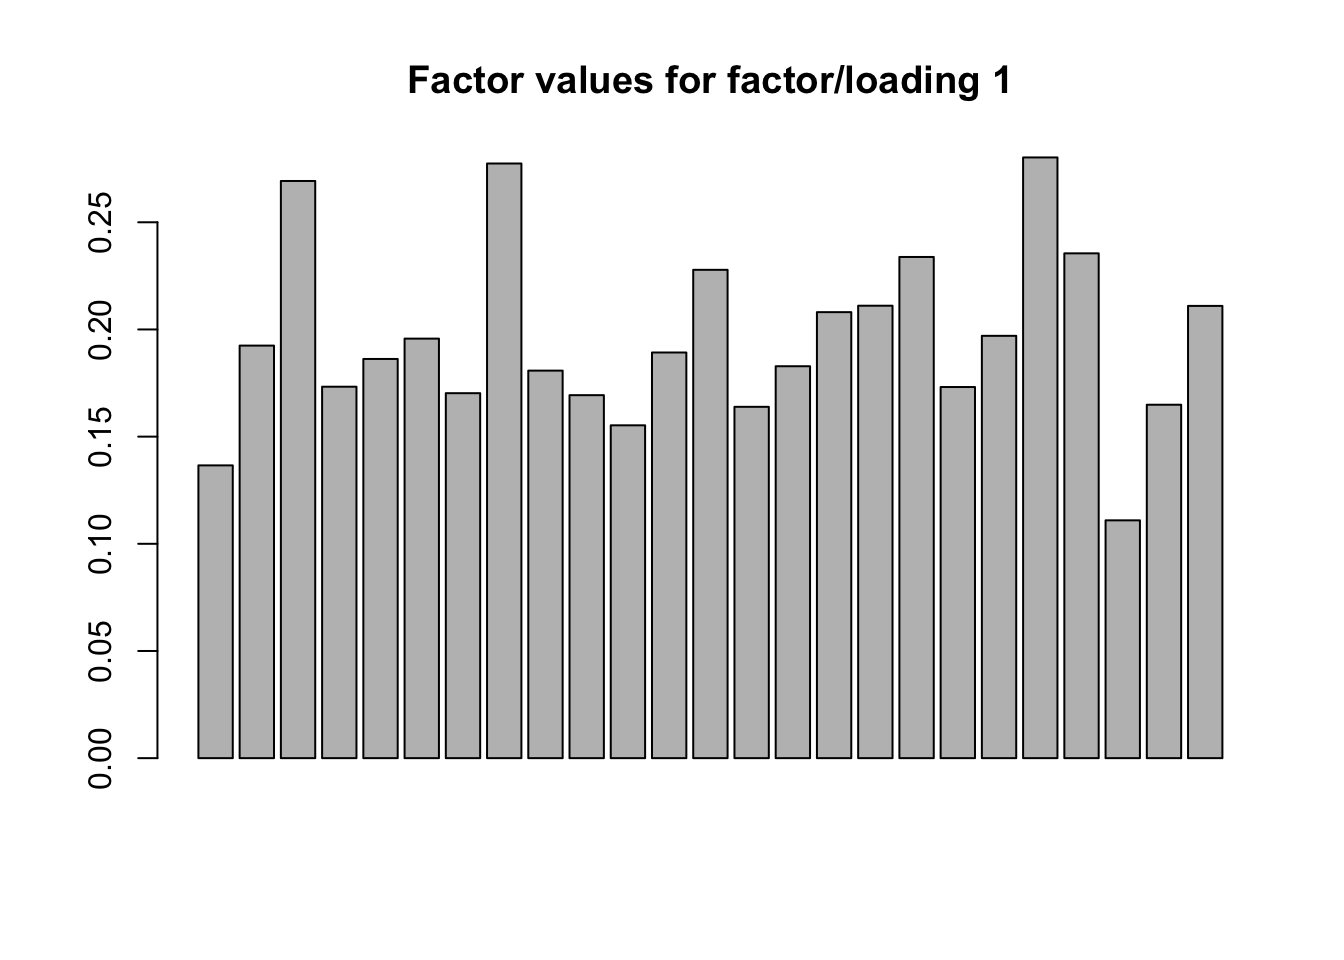
Expand here to see past versions of flash-1.png:
| Version | Author | Date |
|---|---|---|
| 5dac94e | Jason Willwerscheid | 2018-09-15 |
Session information
sessionInfo()R version 3.4.3 (2017-11-30)
Platform: x86_64-apple-darwin15.6.0 (64-bit)
Running under: macOS High Sierra 10.13.6
Matrix products: default
BLAS: /Library/Frameworks/R.framework/Versions/3.4/Resources/lib/libRblas.0.dylib
LAPACK: /Library/Frameworks/R.framework/Versions/3.4/Resources/lib/libRlapack.dylib
locale:
[1] en_US.UTF-8/en_US.UTF-8/en_US.UTF-8/C/en_US.UTF-8/en_US.UTF-8
attached base packages:
[1] stats graphics grDevices utils datasets methods base
other attached packages:
[1] ebnm_0.1-14 flashr_0.6-1
loaded via a namespace (and not attached):
[1] Rcpp_0.12.18 pillar_1.2.1 compiler_3.4.3
[4] git2r_0.21.0 plyr_1.8.4 workflowr_1.0.1
[7] R.methodsS3_1.7.1 R.utils_2.6.0 iterators_1.0.9
[10] tools_3.4.3 testthat_2.0.0 digest_0.6.15
[13] corrplot_0.84 tibble_1.4.2 evaluate_0.10.1
[16] memoise_1.1.0 gtable_0.2.0 lattice_0.20-35
[19] rlang_0.2.0 Matrix_1.2-12 foreach_1.4.4
[22] commonmark_1.4 CorShrink_0.1-6 yaml_2.1.17
[25] parallel_3.4.3 gridExtra_2.3 xml2_1.2.0
[28] roxygen2_6.0.1.9000 withr_2.1.1.9000 stringr_1.3.0
[31] knitr_1.20 devtools_1.13.4 rprojroot_1.3-2
[34] grid_3.4.3 glmnet_2.0-13 R6_2.2.2
[37] rmarkdown_1.8 ggplot2_2.2.1 reshape2_1.4.3
[40] corpcor_1.6.9 ashr_2.2-13 magrittr_1.5
[43] whisker_0.3-2 scales_0.5.0 backports_1.1.2
[46] codetools_0.2-15 htmltools_0.3.6 MASS_7.3-48
[49] softImpute_1.4 colorspace_1.3-2 stringi_1.1.6
[52] lazyeval_0.2.1 munsell_0.4.3 doParallel_1.0.11
[55] pscl_1.5.2 truncnorm_1.0-8 SQUAREM_2017.10-1
[58] R.oo_1.21.0 This reproducible R Markdown analysis was created with workflowr 1.0.1